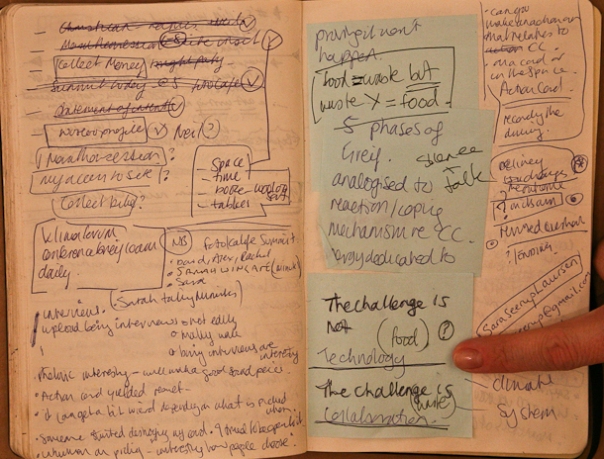
I gave a presentation on artists’ use of diagrams, as part of Diagram Day, organised by Ante Press in residence at London’s FormContent (Feb 13th 2010). My presentation began from a collaborative article on diagrams (with Rachel Lois Clapham and Alex Eisenberg) that will be published in the next issue of Dance Theatre Journal. The presentation was a chance to return to some of the diverse range of materials that I collected for that article, as well as considering the diagram as it has appeared in the projects – by myself and others – documented on this site.
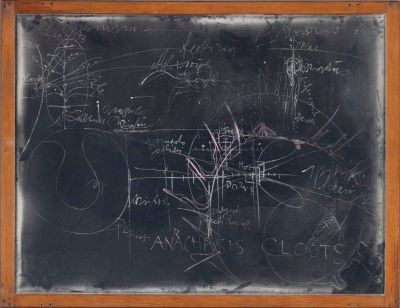
I began by comparing two images – Claude E.Shannon’s drawing of a General Communication System from 1948 and one of Joseph Beuys Blackboard Drawings. The differences and connections of those two models underpinned a lot of what I wanted to explore: the diagram as systematic and linear condensery, and the diagram as spontaneous and gestural drawing-writing-thought. My hunch was that when it comes to contemporary practices, the attraction to diagrams – evidenced by the day itself – seems to be how it enables both of these possibilities. To support this I referenced much of the work contained in two recent publications on this site, including The Secretary is Fired, a minute taking project of Pippa Koszerek, and the various drawing-reading projects of Alex Eisenberg and Pete McPartlan.
The collaboration for DTJ began with Richard Kostelanetz’s celebration of the chart in the introduction to his anthology Essaying Essays. This reads:
One kind of innovation is the conceptually resonant chart, which ideally reveals the essayistic function of compressing a large body of perceptions and/or connections into remarkably little space. Though necessarily simplifying, a chart offers the compensating advantage of vividly documenting the entire picture – a concise image of the whole that reveals contrasts and connections that would not be so apparent if spread over many pages of prose.
A chart is particularly useful in documenting multiple relations among several discontinuous elements. Since charts tend to lack explicit beginnings or definite ends, they cannot be read in the conventional way – steadily, in one predetermined direction, at an even speed. Instead, charts must be read around and about, indeterminately, much like geography maps which are, after all, visual essays of a different sort; for a rich chart offers many levels of meaning, generalization and relatedness…
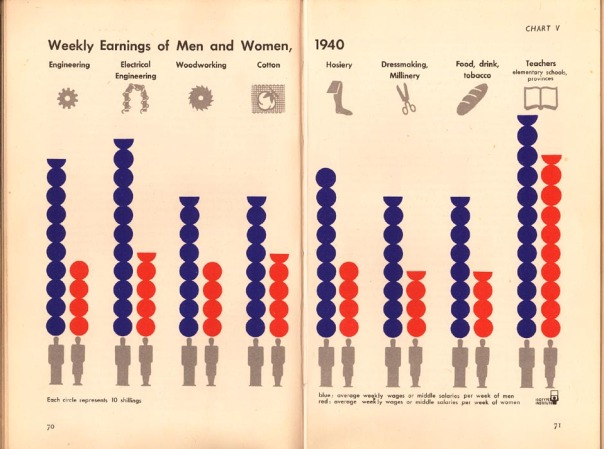
A further starting point was the isotype of Otto and Marie Neurath:
I was drawn to the Neurath’s diagrams by their sense of the diagram as comparative, for their social and geographical reach, and their sense of measure – where each mark in the diagram represented a definite quantity (of people or goods). I have also been trying to think of my own work in relation to Marie Neurath’s definition of “The Transformer”:
From the data given in words and figures a way has to be found to extract the essential facts and put them into picture form. It is the responsibility of the ‘transformer’ to understand the data, to get all necessary information from the expert, to decide what is worth transmitting to the public, how to make it understandable, how to link it with general knowledge or with information already given in other charts. In this sense, the transformer is the trustee of the public. He has to remember the rules and to keep them, adding new variations where advisable, at the same time avoiding unnecessary deviations which would only confuse. He has to produce a rough of the chart in which many details have been decided: title; arrangement, type, number and colour of symbols; caption, etc. It is a blueprint from which the artist works. (77-8)
Thereafter I told of the tragedy of George Macunias. In diagrams such as Expanded Arts Diagram (1966), Macunias represented the diagram at its most condensed and ideographic, but Macunias’ obsession lead him to make charts of ever greater size and complication. His handwritten diagrams – such as Chronology of Russian History (1953-4) – involved handwritten sheets, glued together into fragile agglomerations, to which were added further sheets and lift up flaps. The appeals of the chart as an instant form of communication became negated in a product ever more gnomic and unreadable.
Following the Claude E.Shannon image I looked at George Brecht, who notebooks reveal how he re-worked Shannon’s diagram as part of John Cages night class at the New School. I juxtaposed Shannon’s image with some of Brecht’s scores to highlight similarities and differences of the model of communication implied and activated by each:
Following Beuys I looked at some of the blackborard drawings of Rudolf Steiner. Although the specificity of these images – their “diagram-ness” – is lost without having Steiner himself to explain them (as he draws them), I’m fascinated that the form of the blackboard – and its often mechanistic implications of knowledge transfer – should be used to express Steiner’s sense of other worlds and spiritual kingdoms.
Regarding the long history of diagrams in relation to systems of movement notation, I showed Warhol’s Dance Diagrams – appropriating diagrams of foot movement for particular dances – and Julia Borns poster work, shown as part of the AA’s Forms of Inquiry show.
Wanting to move beyond diagrams themselves towards the stance of the diagrammatic in an artistic practice, I then showed two images by Alex Eisenberg, taken as part of the project QUESTION TIME which happened in Copenhagen during the COP15 climate change talks in December 2009. These show the empty spaces of an auditorium set up to provide a place for UN delegates excluded from the official comference centre, following drastic reductions in the building capacity as security was heightened during the second week of the talks.
We found the space, near midnight on the final night of COP15, as the moment of Obama’s press conference was awaited. Presented in the context of a talk on diagrams, these images seem to become about how we might diagram an event, a place, an issue, taking account of the voids and absences that might be involved.
One artist who might be interested in documenting such complexity, is Ricardo Basbaum, whose project would you like to participate in an artistic experience? begins as a diagram, takes other forms as event and installatrion, and then returns, after each stage of the project, into a new diagram of increasing size and complexity. I love the fact that, reproduced in the format of this blog, they almost seem to be shrinking towards invisibility as the complexity increases!
I was first drawn, however, to more playful and informal aspects of Basbaum’s diagram practice, which – in the excellent CASCO publication THE GREAT METHOD, talking of his Diagram [love Songs] series – he described as follows:
Always composed by words and lines, the diagram is a sort of drawing (or visual poem) that mediates the dynamic flow between words and images – discursive and non-discursive spaces – or literary and plastic spaces, etc… Many times I have taken the diagrams as a tool to connect my practice as an artist to other roles in the art system – writer, critic, curator, agent – departing from the visual/verbal monochromatic composition for establishing dialogues with the other… it is always interesting to look through the diagrams searching for the potentially implied fiction layers – then, each diagram points to different plots, as screenplays for movies yet-to-be-done.
When it came to consider recent projects, the talk offered a chance to think through again the Toothbrush Project by Compulsive Holding. I curated this project last November as part of the Guess Work Guest Work project, and I’ m not sure any of us ever used the word “diagram” in relation to this work. The project documented all of the toothbrushes in the artists’ local branch of Boots, representing that as a two sided poster, one side of which was given over to drawings of the brushes, the other to the text taken verbatim from its packaging.
It was how that poster was presented (see image below) that was my reason for including it in this talk. The act required to see the back of the poster via the mirror models what is involved in perceiving and understanding a diagram, where an apparently 2-D schematic identity is actually a front for a complex, 3-D, moving entity, rife with partiality, mirrors and other perceptual challenges ( consider how, to be read in the mirror, the text on the drawings has to be written backwards).
Finally, I presented a video by Rachel Lois Clapham. This will be available on this site later this week . I think it was in Copenhagen during Question Time that RL first began exploring what we might want to call the methodology of the finger. It, too – “it” being “the finger” – seems to have some very diagrammatic traits – a need to point, to connect from somewhere to something else, to draw lines. But it is also somewhat removed from the diagram, both schematic and the gestural varieties.
When I first saw this video I thought the finger was somewhat reptilian, a later day art-writing incarnation of Durer’s rhinoceros. I wanted to show Durer’s rhinoceros in my talk to make this point but each time I re-opened my Power Point the image had vanished to be replaced by a question mark! This video, then, seemed to me to demonstrate a practice of the diagram moving beyond the word “diagram” into more animal modes of art writing.
Don’t forget Rodchenko: “Drawing as it was conceived in the past loses its value and is transformed into diagram or geometric projection.” For further materials, including diagrams by Alex and a written/ spoken dialogue between the three of us, see the next issue of Dance Theatre Journal.
A BIBLIOGRAPHY
I also brought along the following books which were available throughout the afternoon:
Yve-Alain Bois ed. Gabriel Orozco (The MIT Press, 2009).
Richard Kostelanetz, Essaying Essays: Alternative Forms of Exposition (Out of London Press, 1975).
Zak Kyes and Mark Owens eds. Forms of Inquiry: The Architecture of Critical Graphic Design (Architectural Association, 2007).
Marie Neurath and Robin Kinross, The transformer: principles of making Isotype charts (Hyphen Press, 2009).
Astrit Schmidt-Burkhardt, Macunias’ LEARNING MACHINES: From Art History to a Chronology of Fluxus (Vice Versa Verlag, 2003).


[…] A summary of my presentation – which this video concluded – is here. […]
[…] recently, I returned to it as part of a presentation on artist uses of the diagram at London’s FormContent. I showed slides of Foreman’s […]